Combining the current great performance of the Boston Red Sox in the World Series with some visualization analysis for SMART 360° – WorldSeries Analysis 🙂

Overall WorldSeries 2013 Scoring per Inning
So with no understanding of baseball, there is a clear pattern here: 6th and 7th inning scores are combined nearly as much as the rest:
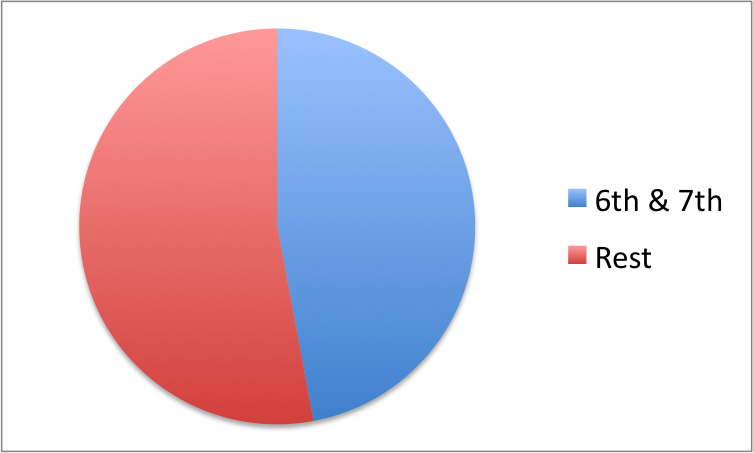
World Series Scoring mainly in 6th and 7th Inning
So my totally uninformed guess is, that even some players fall asleep in that boring game called baseball and that happens around inning 6 and inning 7 😀
And of course Bostonians are better at staying awake:

Scoring Distribution by Team in Innings
Anyone got data from MLB, to see if this pattern is broader? Any other explanation than fatigue?
